


Analyze technique trading is one of the most essential skills every forex trader should learn before entering live markets. In forex, price changes constantly, and traders use chart analysis to understand where the market may move next. Learning this technique gives you the ability to read patterns, identify trends, and make decisions with more confidence.
In 2026, traders continue to rely heavily on technical analysis because charts often reveal price behavior before major market moves happen. This makes chart reading a valuable skill for beginners.
Analyze technique trading means studying market charts to identify possible future price movement. It focuses on historical price action and uses patterns and indicators to predict market direction.
Instead of depending only on economic news, traders analyze chart signals to decide when to enter or exit a trade.
This includes:
It is one of the most practical approaches in forex because price action often repeats in recognizable ways.
The forex market operates 24 hours a day and reacts quickly to economic events. Without technical analysis, traders are often left guessing.
Using analyze technique trading helps traders:
Most professional traders use technical analysis as part of their daily routine because it provides structure to decision-making.
Candlestick charts are the most popular chart format used:
Each candlestick shows four key prices:
A green candle usually means price closed higher. A red candle means price closed lower.
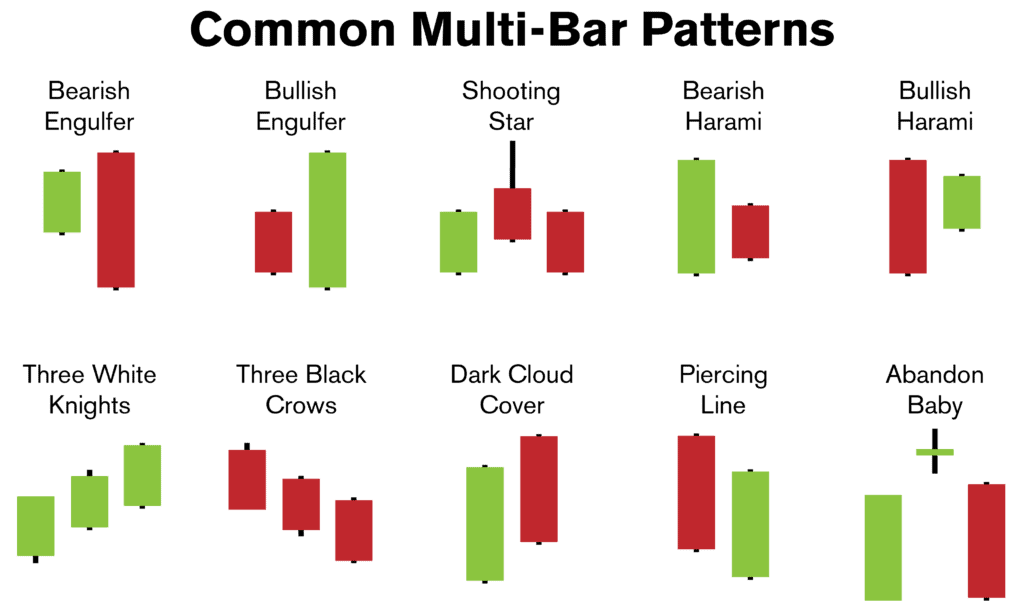
Learning patterns is important for analyze technique trading.
Popular examples include:
These patterns can indicate trend continuation or reversal.
Learn more about the chart patterns: Chart Patterns You Need to know
Support and resistance are essential concepts in technical analysis.


Support is an area where price often stops falling and starts rising.
Resistance is where price often stops rising and may fall.
These zones help traders identify areas where the market may react strongly. Many trading strategies are built around these levels.
Trendlines are another key part of analyze technique trading.


A trendline connects price highs or lows and helps reveal market direction.
Traders use trendlines to:
Simple trendlines can provide strong market context when used correctly.
Technical indicators help support chart analysis.
Relative Strength Index measures market momentum.
Key levels:
RSI can help identify possible reversals but works best with price confirmation.
Moving Average smooths price movement and highlights trends.
Popular options:
Traders often use moving averages to confirm market bias before entering trades.
Many new traders struggle because of common errors.
Adding too many tools creates conflicting signals.
Even strong setups can fail.
Entering trades randomly leads to poor results.
Not every chart pattern is worth trading.
Learning patience is just as important as learning analysis.
The best way to improve is practice.
Start by:
The more you study charts, the better your analysis becomes.
Analyze technique trading is one of the most important foundations in forex. It helps traders understand market structure, identify opportunities, and make better decisions.
In 2026, every beginner should focus on mastering:
With consistent practice, analyze technique trading becomes easier and more reliable.

