EURUSD Bid: --
USDJPY Bid: --
GBPUSD Bid: --
USDCHF Bid: --
AUDUSD Bid: --
USDCAD Bid: --
NZDUSD Bid: --
EURGBP Bid: --
GBPJPY Bid: --
WTI Bid: --
BRENT Bid: --
XAUUSD Bid: --
XAGUSD Bid: --
SPX500 Bid: --
DAX40 Bid: --
US30 Bid: --
JPN225 Bid: --
NAS100 Bid: --
UK100 Bid: --
BTCUSD Bid: --
ETHUSD Bid: --
LTCUSD Bid: --
XRPUSD Bid: --
EURUSD Bid: --
USDJPY Bid: --
GBPUSD Bid: --
USDCHF Bid: --
AUDUSD Bid: --
USDCAD Bid: --
NZDUSD Bid: --
EURGBP Bid: --
GBPJPY Bid: --
WTI Bid: --
BRENT Bid: --
XAUUSD Bid: --
XAGUSD Bid: --
SPX500 Bid: --
DAX40 Bid: --
US30 Bid: --
JPN225 Bid: --
NAS100 Bid: --
UK100 Bid: --
BTCUSD Bid: --
ETHUSD Bid: --
LTCUSD Bid: --
XRPUSD Bid: --

Technical Analysis Indicators: 7 Powerful Tools Every Trader Must Know in 2026

Posted: 4th May 2026

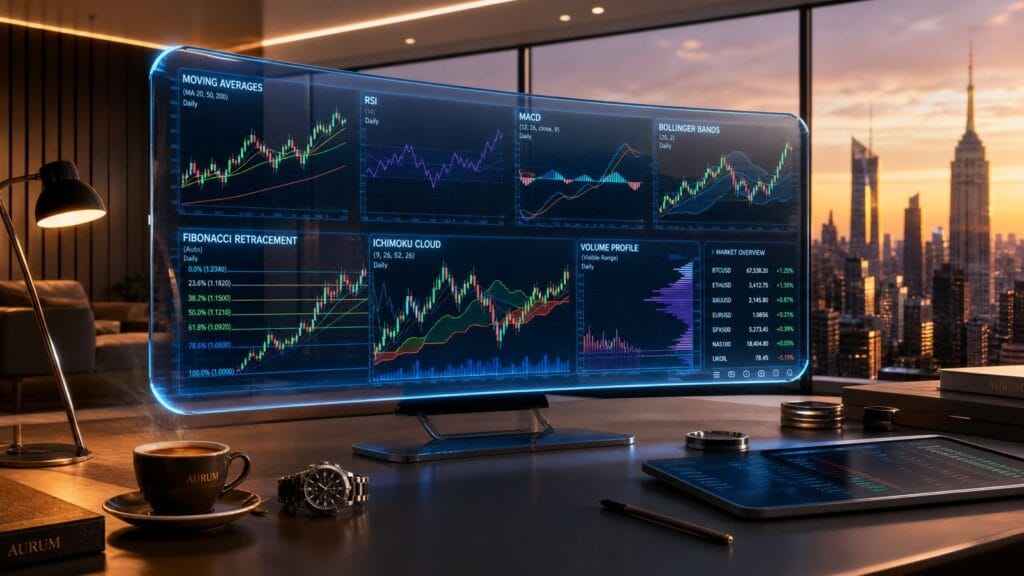
technical analysis indicators trading chart showing RSI, MACD, and moving averages on forex price graph

Technical analysis indicators are essential tools used by traders to analyze price movements and make informed decisions in financial markets. Whether you are trading forex, stocks, commodities, or indices, mastering technical analysis indicators helps you understand market behavior without relying on guesswork or emotions.

Instead of predicting markets blindly, traders use technical analysis indicators to interpret price action, identify trends, and find high-probability trading opportunities.

What Are Technical Analysis Indicators?

Technical analysis indicators are mathematical calculations based on price, volume, or market data. They are applied to charts to help traders identify trends, momentum shifts, volatility levels, and possible entry or exit points.

These indicators are widely used because they:

  • Remove emotional bias from trading decisions
  • Help identify market trends early
  • Improve timing for entries and exits
  • Support risk management strategies

In simple terms, technical analysis indicators turn raw price data into actionable trading insights.


1. Moving Averages (MA)

Moving Averages are one of the most widely used technical analysis indicators in trading.

SMA=P1+P2+...+PnnSMA = \frac{P_1 + P_2 + ... + P_n}{n}

They smooth out price action to show the overall trend direction.

Key uses:

  • Identify bullish or bearish trends
  • Act as dynamic support/resistance
  • Filter out market noise

2. Relative Strength Index (RSI)

RSI is a momentum-based technical analysis indicator that measures the speed and strength of price movements.

RSI=100−1001+RSRSI = 100 - \frac{100}{1 + RS}

Interpretation:

  • Above 70 → overbought conditions
  • Below 30 → oversold conditions

RSI is commonly used to identify potential reversal zones in the market. However, in strong trends, RSI can remain overbought or oversold for extended periods.

3. MACD (Moving Average Convergence Divergence)

MACD is a trend-following technical analysis indicator that shows momentum shifts.

Traders use MACD to:

  • Confirm trend direction
  • Spot reversals
  • Identify entry signals

4. Bollinger Bands

Bollinger Bands are volatility-based technical analysis indicators.

Signals:

  • Upper band = potential overbought
  • Lower band = potential oversold
  • Band expansion = high volatility

5. Support and Resistance

These are core price levels used in all technical analysis indicators strategies.

Why they matter:

  • Support = buying zone
  • Resistance = selling zone
  • Breakouts often signal strong moves

6. Fibonacci Retracement

A popular technical analysis indicator used to predict pullback zones.

Key levels:
23.6%, 38.2%, 50%, 61.8%


7. Volume Indicators

Volume confirms the strength behind price movement.

Rule:

  • High volume = strong trend
  • Low volume = weak move

How Traders Combine Indicators

Professional traders never rely on just one technical analysis indicator.

Examples:

  • RSI + Support/Resistance
  • MACD + Moving Averages
  • Bollinger Bands + Volume

The combination improves accuracy and reduces false signals.

For deeper understanding of technical analysis:
https://www.investopedia.com/technical-analysis-4689657/


How to Use MT4 and MT5 for Trading

MetaTrader 4 (MT4) and MetaTrader 5 (MT5) are the most widely used trading platforms for applying technical analysis indicators.

They allow traders to:

  • Add indicators like RSI, MACD, and Moving Averages
  • Analyze real-time charts
  • Execute trades directly from the platform
  • Use automated trading tools (Expert Advisors)

Watch this video to learn more the difference about MT4 and MT5.


FX Axe Broker Support & Services

If you are learning trading or already active in the market, FX Axe provides support and broker-related services:

Support Email: [email protected]


Broker Deals & Reviews

Explore trusted trading conditions and broker partnerships:

FX Axe Broker Deals: https://fxaxe.com/broker-deals

FX Axe Broker Reviews: https://fxaxe.com/broker-reviews

These resources help traders compare conditions, spreads, and trading environments before choosing a broker.


Final Thoughts

Technical analysis indicators are not magic tools—they do not guarantee profits. However, they help traders make structured, disciplined, and data-driven decisions.

The key to success is not using one indicator alone, but combining multiple technical analysis indicators to confirm signals and reduce risk.

With practice, patience, and proper risk management, traders can significantly improve decision-making and consistency.

Want to learn about MT4 and MT5?

Follow us on
Website Managed by BuiltByGo
Disclaimer: The information provided on FX Axe is for educational and informational purposes only and should not be construed as financial advice. Trading Foreign Exchange (FX), Contracts for Difference (CFDs), and other leveraged financial products involves a high level of risk and may not be suitable for all investors. Leverage can work both to your advantage and disadvantage, and as a result, you may lose more than your initial investment. Before deciding to trade FX, CFDs, or any other financial instrument, you should carefully consider your investment objectives, level of experience, and risk tolerance. You should not invest money that you cannot afford to lose. It is strongly advised that you seek independent financial advice if you have any doubts. FX Axe does not provide investment, tax, legal, or financial advice of any kind. We may receive compensation from brokers and partners featured on this website, but such relationships do not influence our reviews or recommendations. All reviews are based on our own opinions and research and should not be interpreted as endorsements or guarantees of any service. Past performance is not indicative of future results. The trading of FX and CFDs carries a significant risk of loss. By using this website, you acknowledge that FX Axe bears no responsibility for any losses you may incur from your trading activities or reliance on information provided here.

Affiliate Disclosure: Some of the links and references on FX Axe may relate to third-party brokers or service providers. In certain cases, we may receive compensation if you choose to engage with these providers through our website. This helps support the ongoing operation of the site and allows us to continue publishing content at no direct cost to our readers. Our content is created with the aim of being informative and useful. While commercial relationships may exist, we strive to ensure that the information presented remains objective and based on our own research and perspective.
cross